How I’d Use the Mavic 3M for Windy Highway Corridor Surveys
How I’d Use the Mavic 3M for Windy Highway Corridor Surveys Without Losing Agronomic Detail
META: A practical, expert-led guide to using the DJI Mavic 3M for windy highway corridor surveys, combining multispectral capture, low-altitude ground-truthing, and GIS photo-point workflows for better crop and roadside vegetation decisions.
Highway surveying with a Mavic 3M gets complicated the moment the job extends beyond pavement edges.
On paper, a corridor survey sounds straightforward: fly the route, collect imagery, build the map, deliver the layers. In the field, especially in windy conditions, the real challenge is that the highway is rarely the only thing that matters. You’re often working through agricultural edges, drainage strips, embankments, revegetation zones, and utility easements where vegetation condition can influence erosion risk, maintenance timing, and landowner coordination. That’s where the Mavic 3M becomes more than a mapping aircraft. Used well, it becomes a bridge between corridor surveying and crop or vegetation interpretation.
The key is not treating multispectral output as if it can answer every question by itself.
Why the Mavic 3M matters on a windy corridor job
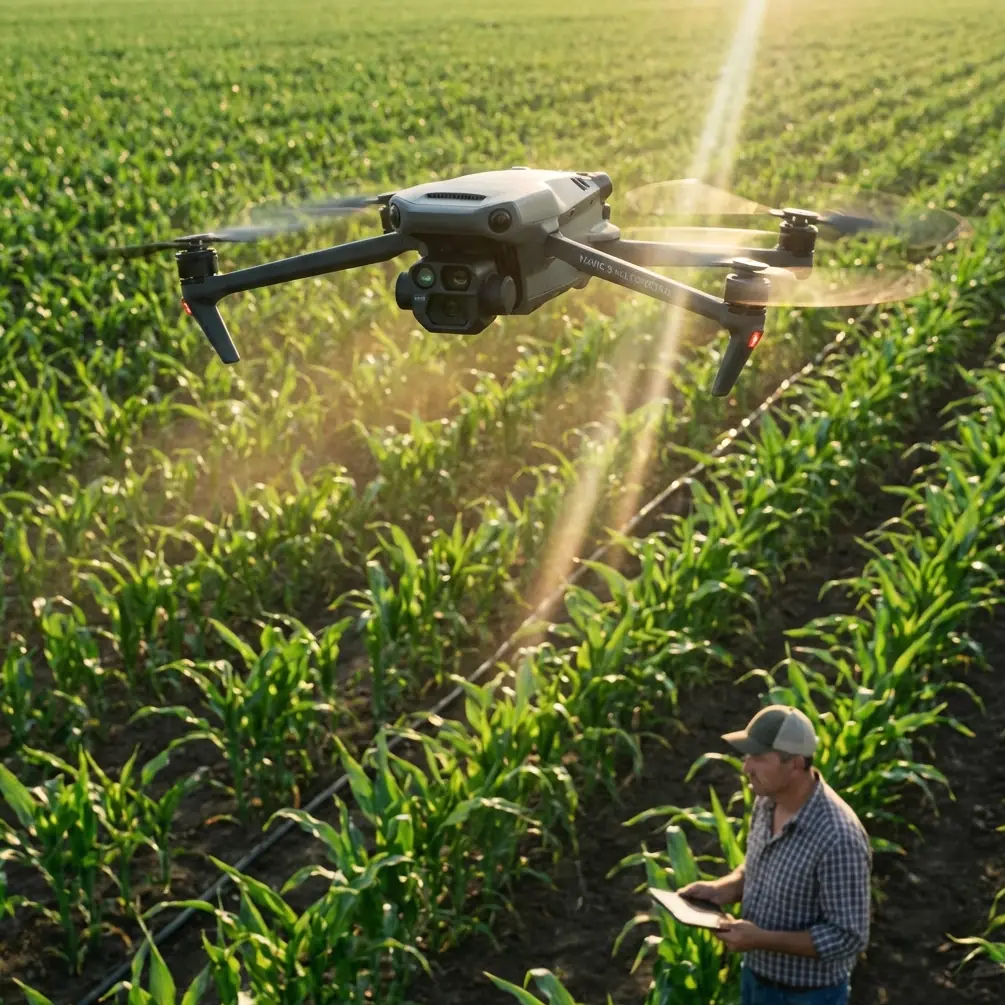
The Mavic 3M is attractive for this kind of work because it brings multispectral capture into a platform compact enough for short-stop deployment along roadsides. For highway teams, that changes field rhythm. You can move between launch points quickly, respond to shifting wind windows, and still collect data dense enough to support corridor-level analysis.
But the real value is operational, not just technical. In a windy survey scenario, flight planning tends to get conservative. Groundspeed changes. Overlap margins need attention. Battery strategy matters more than it does on calm farmland. Along a highway, you also have turbulence near cut slopes, tree lines, bridges, and passing traffic corridors. A drone that can be deployed quickly and recover usable data despite those conditions has a practical advantage.
That said, one mistake I see often is assuming a multispectral mission alone will tell you exactly what’s growing along every affected parcel or disturbed strip. It won’t. The reference material makes this point clearly in a different agricultural context: even when you zoom in on orthomosaic imagery, you still may not be able to identify a specific crop simply by trying to see the leaves. That limitation matters on highway work too. You can flag variability from the air, but if the client needs defensible interpretation, you still need field-linked sample evidence.
The field method I recommend: combine corridor mapping with ultra-low sample capture
If I were building a repeatable workflow for a windy highway project with the Mavic 3M, I would divide the job into two layers.
Layer 1: corridor-wide multispectral coverage
First, fly the larger corridor to produce the broad vegetation map. This is where the Mavic 3M earns its place. You’re looking for pattern recognition across a long linear environment: stressed vegetation on embankments, uneven establishment in revegetation zones, moisture-related anomalies near drainage structures, and variation in neighboring crop health where runoff, dust, or maintenance access may be affecting the edge conditions.
Multispectral data is especially useful because plant condition is not just about visible color. The reference material on hyperspectral crop monitoring highlights why spectral analysis matters: shifts in reflectance and red-edge behavior can reveal changes in chlorophyll-related condition, pigment content, and broader plant status before those changes are obvious to the eye. Even though that source discusses hyperspectral systems, the principle carries over directly to Mavic 3M operations: spectral data helps separate “looks green” from “is performing normally.”
For highway teams, this distinction is valuable. A roadside strip can appear acceptable in RGB imagery while still showing stress that points to poor establishment, nutrient imbalance, compaction, or drainage issues. If the corridor runs beside agricultural blocks, those same spectral patterns can help identify where road-related impacts may deserve closer review.
Layer 2: ultra-low-altitude sample photos for interpretation confidence
Now comes the part many people skip.
The ArcGIS workflow in the reference documents describes a simple but powerful idea: when orthophotos cannot clearly distinguish crop type or field condition, fly at ultra-low altitude and take photos that actually show the leaves. Those images then become interpretation sample points for office analysis.
That is exactly the discipline I’d apply with a Mavic 3M on a highway corridor.
After the broader mapping flight identifies zones of interest, I’d return to selected roadside parcels, revegetation patches, or agricultural edges and capture low-altitude sample imagery detailed enough to show leaf structure and stand condition. These photos serve as ground-truth evidence tied directly to map locations. Instead of arguing over whether a spectral anomaly reflects weed invasion, stressed cereal, broadleaf volunteer growth, or simple shadow effects, the team has a geolocated visual record.
This is not glamorous work, but it is the difference between attractive imagery and usable intelligence.
The GIS step that turns photos into evidence
The strongest detail in the ArcGIS reference is not the low-altitude flight itself. It’s what happens next.
Using ArcMap’s GeoTagged Photos To Points tool, the analyst can batch-read GPS information from each field photo and automatically create a point layer. If the output is written to a File GDB, the photos can also be stored as attachments to each point. That sounds minor until you’ve worked a corridor project with dozens or hundreds of sample images.
Operationally, this matters for three reasons.
1. It preserves traceability
Each sample image is anchored to a location rather than trapped in an unlabeled folder. When a project manager asks why a certain segment was classified as stressed grass cover or a neighboring block edge was flagged for follow-up, the analyst can click the point and open the actual photo.
2. It avoids a common data-loss mistake
The source is explicit: if you output to a Shape file instead of a geodatabase, the option to add photos as attachments is unavailable. Shape format cannot carry those image attachments. For corridor vegetation interpretation, that is a serious downgrade. You still get points, but you lose the clean photo-to-point linkage that supports review and reporting.
3. It accelerates office interpretation
Once the sample points sit on top of the orthomosaic and multispectral layers, office staff can compare canopy-level patterns with leaf-level evidence quickly. The result is a more defensible map and fewer calls back to the field.
On long highway jobs, this saves more time than most teams expect.
How this helps when wind disrupts your “perfect” plan
Wind changes how you should think about certainty.
In calm conditions, crews often trust broad-area data more than they should. In windy conditions, smart crews do the opposite: they add targeted verification. Gusts can reduce image consistency, complicate edge coverage, and create timing pressure that pushes teams to accept “good enough” corridor capture. That is precisely when low-altitude sample points become more valuable.
If one segment was flown in a rougher window and another in cleaner air, the geotagged sample workflow helps normalize interpretation quality across the project. You’re no longer relying entirely on the mosaic to answer detailed biological questions.
I’ve seen this play out on roadside vegetation reviews where one embankment looked like simple vigor variation from the top-down dataset, but low-altitude checks revealed mixed establishment with patches of broadleaf weeds and shallow-rooted grass. That distinction matters if the next decision concerns erosion control, mowing schedule, reseeding, or landowner communication.
Multispectral isn’t only for vigor maps
A lot of Mavic 3M content stays stuck at the level of “use vegetation indices and find stress.” That’s too shallow for serious users.
The more interesting insight from the reference data is that spectral sensing can support quality-related interpretation, not just growth status. One source notes that remote sensing research has been used to monitor grain-quality-related indicators such as protein and starch accumulation, and specifically cites very strong relationships between canopy indices like R1500/R610 and R1220/R560 and wheat grain protein or starch accumulation after heading.
You’re not going to turn a highway survey into a grain lab. That misses the point.
The operational takeaway is that spectral variation can reflect more than surface greenness. It can connect to physiological and compositional differences that matter economically. Along a highway corridor bordering cropland, that changes how you frame drone findings. Instead of simply saying “crop edge variability observed,” a more informed consultant can explain that spectral anomalies at field margins may justify closer agronomic review because crop quality-related effects sometimes emerge through canopy spectral behavior before they are obvious in standard imagery.
That is a more responsible interpretation, and clients notice the difference.
A practical wildlife note from the field
One of the best arguments for compact survey drones in corridor work has nothing to do with sensors on a spec sheet. It’s how quickly you can react to what the corridor throws at you.
On one windy roadside vegetation survey, we had a red fox break from cover near a drainage swale while the aircraft was repositioning along the embankment edge. That kind of encounter changes the immediate flight decision. You pause, widen your buffer, let the animal clear the area, and then resume from a safer line. The advantage of a compact platform like the Mavic 3M is that this adjustment is easy to make without blowing up the whole operation.
That may sound like a small anecdote, but it captures a larger truth: corridor surveys are live environments. Traffic, wind, birds, wildlife, and uneven terrain all shape the mission. Good operators build workflows that tolerate interruption.
Don’t confuse public excitement with field readiness
One recent aviation event in Shanghai made a useful point for this industry, even though it wasn’t about highway surveying. The “空中花园” drone carnival that opened on March 28 and ran through April 19 gave the public unusually close access to aircraft through an open-display format. Visitors could approach the airframes, inspect details, even sit in cockpits and speak directly with technical staff.
That kind of open, tactile exposure matters because it narrows the gap between aviation as spectacle and aviation as working infrastructure.
For Mavic 3M users, the lesson is simple: practical adoption grows when people understand the machine as a tool, not a novelty. Highway agencies, engineering firms, agronomy advisors, and land managers are more likely to use multispectral drones correctly when they can connect sensor capability to a field problem they already recognize—uncertain vegetation classification, corridor-edge stress, drainage-linked plant decline, or disputed land impact.
A drone doesn’t become valuable because it is advanced. It becomes valuable when the workflow around it is disciplined.
My recommended Mavic 3M corridor workflow
If you’re surveying highways in wind and need vegetation intelligence that stands up under review, this is the sequence I’d use:
Plan corridor segments conservatively Break long sections into manageable flight blocks based on wind exposure, terrain breaks, and safe launch/recovery points.
Capture multispectral data first Use the Mavic 3M to identify broad vegetation patterns, roadside stress zones, drainage effects, and crop-edge anomalies.
Mark uncertainty, don’t hide it If a segment raises classification doubts, label it for targeted verification instead of forcing a confident interpretation from mosaic data alone.
Fly ultra-low sample passes Collect close images where leaves and stand characteristics are actually visible. This is critical where orthophotos can’t distinguish species or condition reliably.
Convert photos to GIS points Use GeoTagged Photos To Points so every sample image becomes a map feature. Store outputs in a File GDB, not Shape format, if you want the photo attachments preserved.
Interpret with both canopy and leaf evidence Compare multispectral signatures against sample-point photos to separate stress, species differences, weed presence, and establishment issues.
Report operational significance Explain what the findings mean for maintenance, revegetation, drainage management, adjoining agriculture, or follow-up inspection.
If you’re building that kind of workflow and want to compare field setups or GIS handoff options, you can message me directly here: share your corridor survey details
What separates strong Mavic 3M work from average work
Not flight speed. Not pretty orthomosaics. Not the number of indices in the final PDF.
The difference is whether the operator understands where aerial data ends and interpretation begins.
The source material gave us two useful anchors. First, close leaf-level imagery can still be necessary because even a high-resolution orthophoto may not tell you exactly what crop or plant type you’re looking at. Second, advanced spectral sensing can reveal biologically meaningful differences tied to chlorophyll, pigments, carbon-nitrogen balance, and even quality-related crop outcomes.
Put those together, and the right way to use a Mavic 3M on windy highway survey work becomes clear. Use multispectral data to map patterns at scale. Use ultra-low-altitude photo samples to verify what those patterns mean on the ground. Then lock that evidence into GIS in a format that preserves photo attachments and reviewability.
That is how you turn a drone flight into a corridor decision tool.
Ready for your own Mavic 3M? Contact our team for expert consultation.